Information Visualization Hands-On
Impact and Clarity with Data
We are increasingly confronted with vast amounts of data that we need to understand. Visual cues that we need to decipher surround us.
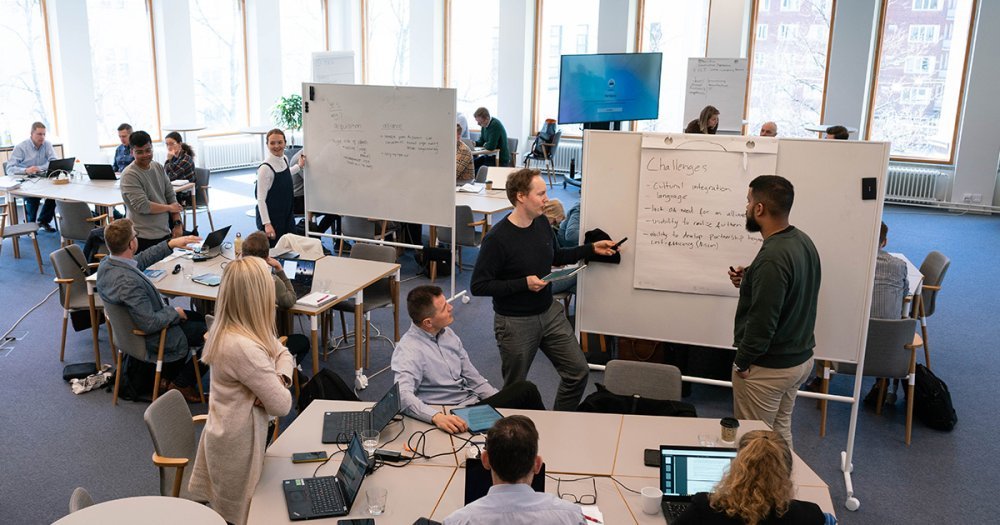
The Information Visualization Hands-On program is the next step from the Information Visualization online course. The Information Visualization online course familiarizes you with the must-know, should-know, and nice-to-know when visualizing information. You will get a concise understanding of what information visualization is, why it is needed, and how to get started. The hands-on training continues from the lessons learned during the online course with an instructor and a peer feedback loop.
To take part in and benefit from the Information Visualization hands-on program, you must first complete the Information Visualization online course. You should also have chosen your own visualization project, which you will focus on during the hands-on training. You will study and share your lessons learned with your peers and meet the faculty for expert feedback.
Immerse yourself in developing your own visualization project with support from peers and theme experts
Get inspired and motivated to pursue your own chosen path in information visualization
Benefits
The program enables you to link the theoretical background with your own practical projects in the workplace. You may like to work on one extensive project, developing and pivoting it along the way, or prepare a set of visualization templates that you can employ in your organization every day.
For
The program is designed for those who want a concise overview of what information visualization is all about and want to do a practical project as well as receive expert feedback. It focuses on making quantitative data understandable and usable. You will understand and learn to decipher visualizations and what is behind them and learn to do visualizations of your own. You may work in BI, research, development, marketing, communications, design, and so on.
The program is for you if you
- need to make statistics live and compelling,
- have the task of making research results intelligible for investors or the public,
- need to make sense of complex data for your customers or other stakeholders,
- are aiming to recognize and highlight anomalies in large amounts of data, or
- are trying to get your message through and accepted, but the data is vast and fuzzy.
Contents and Schedule
The program deepens your knowledge and skills on the topics you studied during the Information Visualization online course. You will be working on a project you bring from your own organization to develop and pivot along the way. Alternatively, you may like to construct some templates that you can later use in your everyday work for your most common needs.
Before starting the hands-on program, you are expected to complete the Information Visualization online course. It will give you the theoretical background to the topic. In the hands-on program, your own visualization project will be in focus. You will be learning and sharing with your peers and meet the faculty for expert feedback.
Information Visualization Online Course
Completing or revisiting the Information Visualization online course (to be purchased separately)
Project Work
Working on your own visualization project
Joint Webinars and Workshops
Studying and assessing practical examples, pitching your own project
Modules
Instructor

Tomi Kauppinen
Tomi Kauppinen is the head of Aalto Online Learning at Aalto University. His background is in media technology and computer science. He aspires to bring an entrepreneurial mindset and lean and agile creativity to all his projects and teaching.
Tomi Kauppinen is Head of Aalto Online Learning at Aalto University. He holds a habilitation (2014) in geoinformatics from the University of Muenster in Germany and the title of docent (2014), a Ph.D. (2010) in media technology from Aalto University, and an M.Sc. (2004) in computer science from the University of Helsinki. Kauppinen's passion is to create, study, and teach information visualization, spatial thinking, cognitive systems/artificial intelligence, and blended learning design. Since 2016, he has led the Aalto University-wide strategic development initiative, Aalto Online Learning, which covers activities ranging from blended learning to fully online textbooks and exercises, from video production to online social interaction, from artificial intelligence-based recommendations and assessment to interactive visual simulations, and from augmented/virtual reality to games and gamification. With his background in startups before a calling to academia, he aspires to bring an entrepreneurial mindset and lean and agile creativity to all his projects and teaching.
Program Fee and Registration
See Other Programs That Might Interest You

Schedule April 3 – May 26, 2025
Location Aalto University Töölö, Helsinki, Finland or live online
The program helps you understand the central aspects of successful B2B sales, as well as customer purchasing behavior in changing times where value, not price, is the decisive factor.
Fee: € 4,200 (+ VAT)

Schedule April 9–10, 2025
Location Aalto University Töölö, Helsinki, Finland
Frequency Once a year
The program trains participants to explore, validate, and scale new business models and/or renew existing ones. Participants will go back to their organizations with proven tools and practices to systematically build new, scalable businesses with greater agility, customer centricity, and innovativeness.
Fee: € 2,900 (+ VAT)
May 26–28, 2025

Schedule May 26–28, 2025
Location Aalto University Töölö, Helsinki, Finland
Frequency Once a year
You will get a comprehensive understanding of strategic marketing and how strategic marketing is crucial in driving growth by being or becoming customer-centric.
Fee: € 4,650 (+ VAT)
August 28–29, 2025

Schedule August 28–29, 2025
Location Aalto University Töölö, Helsinki, Finland or Live online
Frequency Once a year
The program gives you versatile perspectives on communication as part of responsible business. You will learn to analyze the starting points of the credibility of responsibility communication and evaluate your organization and its activities as a builder of a sustainable society.
Fee: € 2,100 (+ VAT)
September 4 – December 4, 2025

Schedule September 4 – December 4, 2025
Location Aalto University, Espoo, Finland
This comprehensive hands-on program brings together the management and experts of Finnish fashion, design, and lifestyle consumer brands to develop customer insight, commercialization strategies, and multichannel strategies for international markets.
Fee: € 2,400 / € 1,200 (+ VAT)
September 26 & October 1–2, 2025 (FI)

Schedule September 26 & October 1–2, 2025 (FI)
Location Aalto University Töölö, Helsinki, Finland
Frequency Twice a year
The program is a practical, hands-on, and effective program providing the participants with in-depth experience backed by the latest business practices and live case studies bringing the participants' negotiation and persuasion skills to the next level.
Fee: € 3,150 (+ VAT)
October 6 – December 9, 2025

Schedule October 6 – December 9, 2025
Location Aalto University, Espoo, Finland and Live online
The program handles the most topical themes of digital marketing at both the strategic and tactical levels, from a customer-oriented perspective. You will gain an overview of digital marketing and sales, involving the integration of digital and analog marketing practices in support of your business objectives and strategy.
Fee: € 3,950 (+ VAT)
October 8, 2025 – February 6, 2026

Schedule October 8, 2025 – February 6, 2026
Location Aalto University Töölö, Helsinki, Finland
Frequency Once a year (starting in fall)
The program will increase your understanding of the role played by a customer strategy as part of your business’s overall strategy, and provide tools for the goal-based development and implementation of the KAM process. You will learn how to work with important customers and adopt hands-on tools for the development and management of customer processes.
Fee: € 4,100 (+VAT)
Ask for Further Information

Schedule Ask for Further Information
The executive program considers pricing from a strategic management perspective. The program introduces alternative strategies that provide insights for improving pricing decisions that directly impact a company’s financial performance.
Ask for Further Information

Schedule Ask for Further Information
Location Aalto University Töölö, Helsinki, Finland and online
This program is the next step from the Information Visualization online course. The program is suitable for those who want a concise overview of information visualization and want to do a practical project and receive expert feedback. It focuses on making quantitative data understandable and usable. You will understand and learn to decipher visualizations and what is behind them and learn to do visualizations of your own.
Fee: € 1,650 (+ VAT)
Estimated Study Time: 12 hours

This online course provides a toolbox to better understand and analyze recent developments in service management. Course language: English
Fee: € 200 (+ VAT)
Estimated Study Time: 10 hours

Schedule Estimated Study Time: 10 hours
Location E-learning environment
In this online course, you will focus on marketing strategies, segmentation, targeting and positioning, integrated marketing communications, proactive value-based selling, structured influencing, contemporary sales approaches, and personal selling skills. Course language: English
Fee: € 200 (+ VAT)


